ExplainSpeaking: State of the Indian economy in 6 charts
The Indian Express
August 10, 2020
Dear Readers,
John Kenneth Galbraith, the Canada-born US economist, who also served as the ambassador to India in the early sixties, held that “There are two kinds of forecasters: those who don’t know, and those who don’t know they don’t know”.
So with apologies to Galbraith, let’s try to look at five charts, courtesy the Reserve Bank of India and the five surveys it conducts regularly, to map the state of the economy.
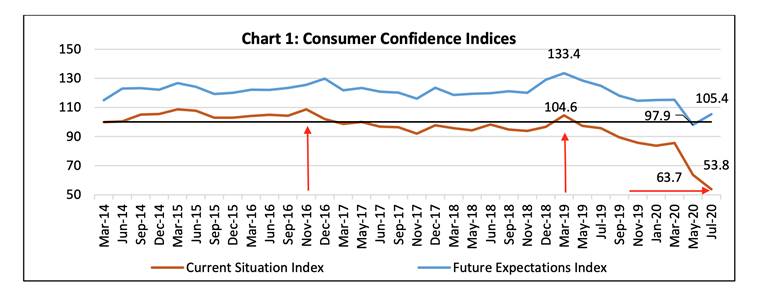
Chart 1 alongside maps the state of consumer confidence in the economy. The red line maps the current consumer confidence and the blue line tracks the consumer expectation a year from now. Over 5,300 households across 13 major cities in India are asked questions about the economic situation, income, spending, employment and the price level.
As the red line shows, the consumer confidence index continues to plummet and has hit an all-time low of 54 in July. It is interesting to note that the past two peaks were in March 2019 — the time when the current government was getting re-elected — and in November 2016 — when demonetisation was announced.
 Consumer confidence indices
Chart 2 captures the business confidence of Indian manufacturing companies for Q1:2020-21 (April, May, June) — shown by blue line — and their expectations for Q2:2020-21 (July, August, September) — shown by the red line. Both these business indices provide a snapshot of the business outlook in every quarter and take values between 0 and 200, with 100 being the threshold separating expansion from contraction.
As is evident, the current business confidence index fell sharply to an all-time low at 55.3 in Q1:2020-21 from 102.2 in the previous quarter.
 Business confidence of Indian manufacturing companies
The next two charts are taken from the RBI’s OBICUS (Order Books, Inventories and Capacity Utilisation Survey) for the quarter January-March 2020 and it covered 364 manufacturing companies.
Chart 3 shows that even before Covid hit India, new orders were witnessing negative growth (year-on-year), represented by the red line. Even quarter-on-quarter growth (blue line) was stagnant.
 Growth on new orders
The red line in Chart 4, which shows the “ratio of raw material inventory to sales”, has been going up since the second quarter (July, August, September) of the last financial year. In essence, it shows the poor state of demand in the economy even before Covid.
The capacity utilisation (not shown in any chart) in manufacturing firms in the economy has come down from 76% in March 2019 to 69.9% in March 2020.
 Inventories to sale ratios
Finally, Chart 5 shows that most professional forecasters — highlighted in green — expect the Indian economy to contract between 5% and 6% in the current financial year.
Given these five survey results, one could reasonably ask why the RBI did not cut interest rates this week in order to boost economic activity.
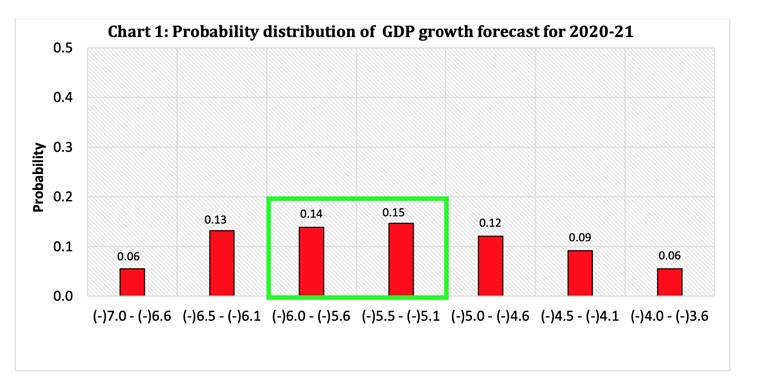 Probability distribution of GDP forecast for 2020-21
There was much consternation about this issue and perhaps deserves a little more detailed explanation.
As it turns out, there is rather compelling evidence to suggest that the RBI may not cut rates even in its next policy review on October 1.
You would have already read that the RBI, which has been furiously cutting repo rate (the rate at which it lends to the banking system) since February 2019, paused this time because it was concerned about high inflation in the economy. (To understand the link between inflation and interest rate read this explainer).
It is true that the RBI’s main focus is to ensure retail prices do not grow at a rate less than 2% or more than 6%; ideally, they should grow at 4%. This, in a nutshell, is the so-called inflation-targeting regime. This calendar year, retail inflation has been above 6% in all months barring March and as such, RBI is obviously concerned.
But there are two other and less obvious reasons.
The first reason is that according to the RBI Act, if retail inflation stays outside the 2%-6% range for more than three consecutive calendar quarters, then the RBI Governor Shaktikanta Das would have to explain to the government why India’s central bank failed to contain inflation within the specified range.
To be sure, there is a very real fear of this happening. Research analysts at the ICICI Securities reckon that with retail inflation likely staying above the 6%-mark in July and August, “there is a good probability of inflation averaging 6% or higher for three consecutive calendar quarters, which would trigger the provision 45ZN in RBI Act requiring the Governor to write a letter to the government explaining the breach…”
The second reason, as shown in CHART 6, relates to poor monetary transmission. In other words, the inadequate manner in which interest rate cuts by RBI are transmitted to the broader economy which includes you and me.
 Repo rate
The red line in this chart represents the lending rate or the interest rate that banks charge people who borrow money from it. The blue line is the repo rate or the interest rate that the RBI charges banks when banks borrow from the RBI.
The crucial bit in the chart is the green dotted line that represents the difference between the blue and red lines. According to Neelkanth Mishra of Credit Suisse, this difference is at an all-time high.
n other words, while RBI is reducing the interest rate it charges the banks, the banks have not reduced their lending rates to you and me commensurately enough. In fact, this difference is at a record high.
That is why it makes sense for RBI to wait for greater monetary transmission to happen before it cuts repo rate further.
Comments
Post a Comment